A recent idea in economic theory is the rise of Thomas Piketty and income inequality as explained in his best selling book, Capital in the Twenty-First Century.
Basically, he says that the United States and European economies are moving back toward the time of the early 20th century, previous to the 1930's where most of the wealth was concentrated in the hands of very few people or the 1% as we have heard before, especially during the 2012 presidential election.
The problem with his and most economists idea of wealth is that they count the money or property people own, not the way people live.
One thing that could be counted is the number of servants the person or family has.
In the early 20th century very few people, probably only the 1%, had any servants at all, and the children of most of the 99% had to go to work to help support the family.
As late as the early 1930's most women washed their clothes on a washboard, cooked on a wood or coal fire, walked wherever they went, and had their children work outside the home, in factories or for the wealthy.
Very few people went to a play, a concert, out to eat, or traveled more than 25 miles from home. Movies were just beginning.
Looking at the United States and Europe now, instead of comparing dollars and property, compare how the people live.
Just what could the wealthy 1% do in the 1900's or even up to the 1930's that most people in these economies cannot do today?
The wealthy could go out to eat, but everyone in America can go out to eat today, that's one of the reasons the so called poor are overweight.
And servants? Everyone has more servants today than the wealthy 1% had in those olden times: washing machines, dishwashers, microwaves for instant cooking,
We have cars. Few of them even had horses.
Communications can't even be compared. Everyone can communicate to anyone they choose, anywhere.
A ten year old child has all of the entertainers of the world at his fingertips in plays/movies and concerts/music, more than the wealthy 1% of the 1930's even could dream of.
No one in America will ever be as poor as our great grandparents of those times, and the wealthy of today cannot do anything more than most of the rest us can, today.
So even though the money may be concentrated, it can't do much for the wealthy that our science and social programs can't do for everyone else. Many of the poor don't even have to work as much as the wealthy 1% do today.
The whole idea is to make people think they are poor so they will support those who claim to be trying to redistribute the income of those who seem to have more.
Saturday, May 31, 2014
Tuesday, April 15, 2014
Some Not-So-Hot Facts About Global Warming Research--Global Cooling
 Here is an amazing article by Keith Schaefer about Global Warming which I received in an email. This is used with permission and the original article can be found here
 "Consider this:
"-In 2013, the UK had the coldest spring since 1963.
"-In March 2013, Northern Japan received record snowfall--up to 16 ft thick just south of Aomori.
"-In October 2013, the worst frost in more than 80 years hit Chile and damaged 50 million boxes of fruit for export—damages were over $1 billion.
"-And my personal favourite—an expedition vessel full of Climate Change scientists became trapped in Antarctic sea ice 10 feet thick on Christmas Day 2013.
"These true-life stories are examples of global cooling—from all over the globe.
"In Parts I and II of this series, I outlined the long term cycle of temperature changes on Earth, and how sunspots have had an eerily accurate correlation to earth's temperatures for centuries. Data strongly suggests that solar cycles have a definite impact on the world's climate.
"And right now, the best data on sunspots also suggest the world is about to enter a time of global cooling. This doesn't deny that mankind is influencing the world's climate; sunspots' very regular 11 year cycles can temporarily overwhelm a larger context of man-made (the scientific term is anthropogenic) influences.
"But even that becomes somewhat suspect. Evidence either uncovered or chronicled by a Boston-based research firm, Unit Economics, suggests that government and their scientists, together and independently, have been manipulating data (and caught red handed!).
"The February 28, 2014 research paper by Unit Economics on global cooling goes into pages of detail on how some of the most important—and allegedly impartial—raw climate data has been regularly altered by private and public sector members of the scientific community.
"And that’s really too bad, because people working on questions around global temperature have very few datasets to choose from.
"One is the temperature anomaly dataset developed by NOAA (the US National Oceanic and Atmospheric Administration). The other is from the Met Office Hadley Centre in collaboration with the Climatic Research Unit of the University of East Anglia in England, which is known as the HadCRUT3 dataset.
"NOAA started developing its temperature database in the early 1990s. It was revised once in 1997, and then three times between mid-2011 and the end of 2012.
"NOAA says the revisions dealt with new observations methods, corrected coding errors, and removed unnatural influences from things like changes in how instruments were stationed.
"In short: lots of revisions, little specific explanation. Not surprisingly, people started accusing NOAA of data tampering (google NOAA data tampering)…and when Unit Economics compared the 2008 NOAA dataset with the most recent version, the changes looked like this:

"Overall, the man-made adjustments created an additional 2.48°F temperature change over the past 100 years – more than the 1.85°F of total warming the NOAA says has taken place since 1913!
"Sadly for the general reliability of science, the HadCRUT3 dataset is no better.
"CLIMATEGATE
"This HadCRUT3 dataset is the basis of the Intergovernmental Panel on Climate Change (IPCC). The IPCC ‘s job is to create a “clear scientific view on the current state of knowledge on climate change and its potential environmental and socio-economic impacts”. That’s a mouthful.
"The IPCC data did show increasing temperatures. Then, in October 2009, someone broke into a British office of the CRU, downloaded 160 MB of data and emails, and posted them online. The stolen CRU emails show prominent scientists discussing ‘adjusting’ data to reduce Medieval Warming Period and hiding very recent cooling trends, and making sure they all agree and aren't stepping on each others' toes. Many of these discussions ended with instructions to delete all records of the conversation.
"Eventually a U.S. Senate inquiry was set up under chairmanship of Edward Wegman, professor of mathematics and statistics, and their report ruled that Penn State Professor and IPCC lead author Michael Mann’s work was ‘statistically invalid’.
"But even all this couldn’t ‘adjust’ away the reality completely: the tampered HadCRUT3 data still shows global temperatures trending lower over the last 15 years.

"And there are some basic facts question the thesis that manmade CO2 is causing global warming. As I said in Part I, temperatures actually fell during the peak expansion of manmade greenhouse gas levels from 1940-1970.
"Second, if CO2 emissions cause global warming the layer of the atmosphere 5 to 10 km above the earth where CO2 interacts with sunlight should be warming more quickly than the earth’s surface. In fact, temperatures at these levels have been unchanged since accurate balloon measurements became available 50 years ago.
"Third, CO2 levels have cycled significantly over the known history, which stretches back 400,000 years. Our planet has survived CO2 levels roughly half of current concentrations and nearly twenty times higher! That certainly makes the commonly quoted claim that a CO2 concentration above 350 ppm leads inexorably to warmer temperatures seem pretty weak.
"Fourth, atmospheric levels of CO2 increased from just under 300 ppm in 1900 to 397 ppm today, yet temperatures fell through much of that period and have increased by only 0.7°F overall – and that’s based on heavily manipulated datasets.
"And there are some groups, such as the Carbon Modeling Consortium at Columbia University, that suggest human activities in United States may actually reduce atmospheric CO2 levels. In an October 15 1998 issue of the Columbia University News, author Taro Takahashi, a senior research scientist wrote:
"'We know that we who reside in the United States emit about 6.2 billion tons of carbon dioxide into the atmosphere each year. As an air mass travels from west to east, it should receive carbon dioxide and the East Coast concentration of CO2 should be higher than on the West Coast. But observervations tell us otherwise.
"'The mean atmospheric CO2 concentration on the East Coast has been observed to be lower than that over the Pacific coast. This means that more CO2 is taken up by land ecosystems over the United States than is released by industrial activities.'
"Other tidbits:
"-Sea levels are DOWN by .2 cm (0.08 inches) since 2006.
-The polar bear population is up all across the Arctic—as much as 66% in the last 50 years and 13% in the last 5 years.
-water vapor in the air has been declining—more vapor, higher temperatures. Less vapor, lower temperatures.
"Again, the current global cooling could be taking place within a larger context of man-made climate change. But even that becomes doubtful when the most basic, raw, original datasets are shown to be corrupted. And there is enough serious scientific peer review to question the IPCC climate reports—thanks go to Canadian Ross McKitrick from the University of Guelph and German scientist (and former Global Warming advocate) Professor Fritz Vahrenholt, who wrote Die Kalte Sonne (the Cold Sun) in January 2012.
"There’s a great quote in Unit Economic’s report that puts this all into context:
"'If one accepts the notion that the sun, which provides over 95% of the heat energy to the surface of the earth, has the potential to impact temperatures, it would be logical to incorporate observations and predictions of solar activity in climate models and forecasts – something most meteorologists and virtually all global warming enthusiasts fail to take into account when modeling earth’s climate. We believe this is because solar cycles explain climate cycles on earth too well, leaving too little room for CO2 to influence their models.' Weiss and Naleski, Unit Economics’ 2014 Report on Global Cooling.
"The Real Inconvenient Truth is that there is enough flawed data to question just how serious Global Warming is, or if it's real at all in the short to medium term. Is the hysteria warranted? Keep your mind open, despite the intense politically correct forces out there who make that a crime on this issue."
Sunday, March 30, 2014
Wednesday, March 12, 2014
ANOTHER PHOTOGRAPH MYSTERY SOLVED!
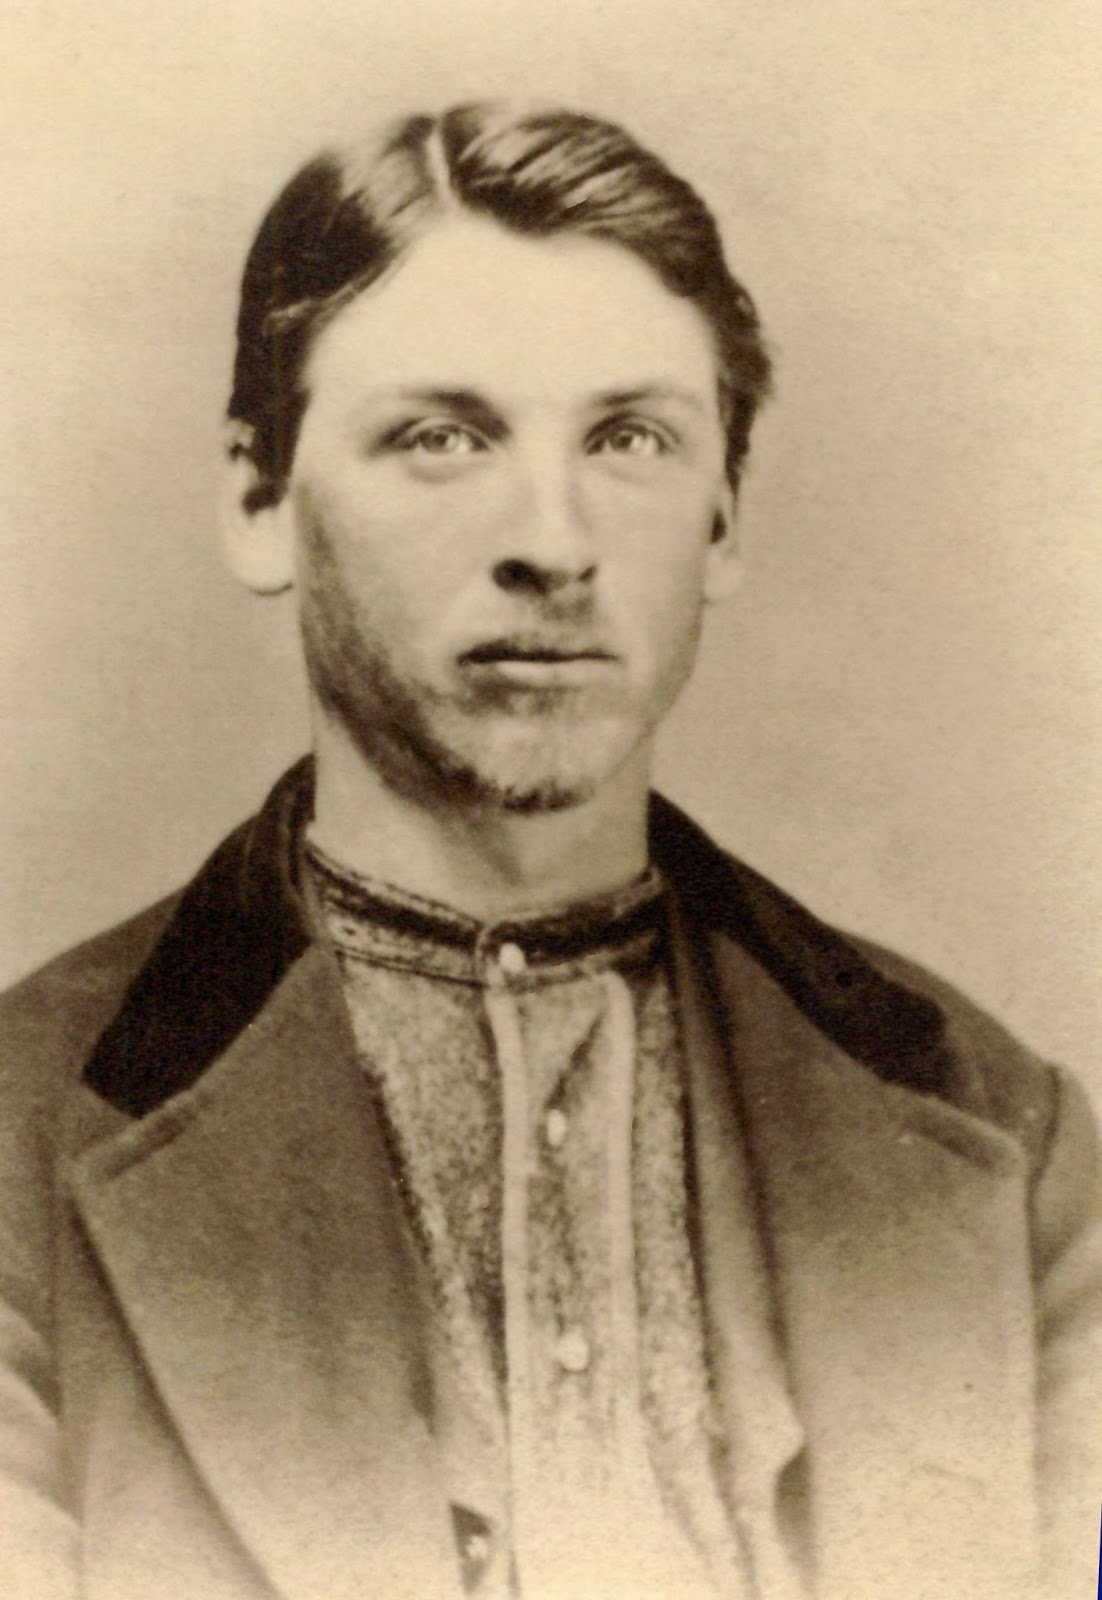
Here is another photograph I finally, just a few weeks ago (2014), deciphered which was in my Grandmother, Alta Bockhouse's things.
I had copied this picture from her photographs before she died, some time in the early 1980's. She led me to believe it was her father, William Riley Hastain. Then somehow I lost the copy. And I have not found the negative.
In those days we did not have very good scanners anywhere. I had photographed it using a close-up lens on my camera. A real camera. You know one of those old things that uses film? It was a relatively good camera, with settings for light exposure and shutter speed, and the speed of the film.
When I began to study the life of William Riley Hastain, I began to believe that this could not have been him. This guy is in a civil war uniform, and I just wasn't sure. He seemed too young, born in 1850, and too far away, living in California. Grandma was sure though, but she had mixed up other people, so I questioned whether it was Riley, (that's what my father called him.)
"But who could it be?" I thought , "If not Riley."
 Quite a while after Grandma Bockhouse died, in 1988, my father and I went to visit my Aunt Florence, his sister, and Grandma Bockhouse's daughter, in Washington. I had the picture with me, and I asked her who it was.
"Isn't that the old man?" she said. I thought she meant William Riley Hastain, so I didn't think about it again for a long time.
Last year in June, I decided to write about our Civil War ancestors. I first wrote a little book titled, "Sheriff Shoemaker," about Dorothy's great great grandfather.
I got the pension file of Grandma Bockhouse's grandfather. It had a lot of interesting information, so I began writing about him, Curtis Purinton. This is him with the violin, above. As I read the information in his military file and his pension file, I began to see that these two pictures must be of the same man, so I decided that the Civil War Soldier must be my grandmothers grandfather rather than her father.
I realized that Florence had called Curtis the "Old Man," earlier when she was talking about listening to him play the violin.
 Sometimes you may have all the information to make an identification, but it just doesn't all fit together. That's because you are trying to put the pieces into the wrong puzzle. I had been trying to make sense of the picture fitting into William Riley Hastain's life who was my grandmother's father, but instead the picture fit into my grandmother's grandfather's life perfectly.
So that solved that problem, but now I had lost the photograph and this one was the only one I had. We turned the house upside down looking for the negative or the print but with no luck.
The only picture I could find was this bad scan of a print I had, but lost.
I sent a copy of the booklet to my sister in Oregon with the bad picture in it and begged her to scan another good copy for me. She was wonderful. She emailed me a copy, and then she sent one scanned at a store.
Thanks Pat
Subscribe to:
Posts (Atom)